Using Empathy as a Design Tool
In this sample chapter from The Art and Science of UX Design, author Anthony Conta introduces the empathize phase in design thinking as crucial for understanding user perspectives. By engaging in research, particularly through conversations, this phase combines the art of navigating human interaction with the science of structured questioning to minimize bias. The goal is to cultivate deep empathy, leading to solutions that significantly improve user experiences.
The first step in the design thinking process is to empathize—to imagine ourselves standing in the users’ shoes, look through their eyes, and feel what they feel. This allows us to better know their like and dislikes, what motivates them, and what gets in their way.
To accomplish this, we need to conduct research with our users. We can conduct lots of types of research, but one of the most common types (which we will go into depth about) is to talk with our users and hear from them directly. Through conversations, we learn more about their experiences and begin to develop the empathy we need.
Empathizing through design thinking is artistic—to have a conversation with someone else is an art form. Navigating the complexity of a conversation—the content, the context, the emotions—all within seconds of a response time requires you to be nimble, attentive, and present. Conversations are unique, and everyone’s style is just a little different.
Empathizing through design thinking is also scientific. There is a methodology in choosing what questions to ask, in what order, and in what ways, so we can avoid bias, allow the participant to feel comfortable, and seek out answers.
By applying both art and science to the empathize phase of design thinking, we can have the conversations that allow us to understand our users’ wants and needs, better understand how to solve their problems, and start to develop a solution that changes their experiences for the better.
Types of Research
You’ve arrived! You’re ready to begin the design thinking process. Looking at the model (FIGURE 2.1),1 you are at the first step: empathize.
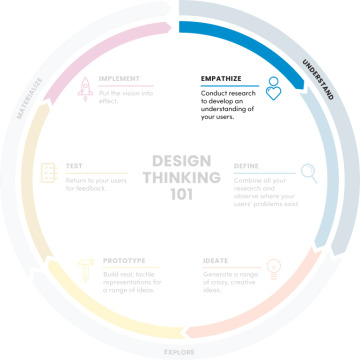
FIGURE 2.1 The NN/g design thinking model. The first step of the model is empathize. It is part of the understand phase of design thinking, where you seek to understand more about your users and the problem you are trying to solve.
You are ready to begin the phase of the project where you try to understand. Who are the users? What are their wants, needs, and goals? What problem are you trying to solve? You will hopefully come to these answers as you move through this phase.
To empathize with users and their problems, you must perform research. You need to talk with the users, or observe them, or learn more about them in some way that lets you empathize with them. Thankfully, there are plenty of research methods that will allow you to do this.
Research, as it applies to design thinking, can be broken into four categories, which are discussed in the following subsections along with ideas from NN/g, the Nielsen Norman Group.2 Christian Rohrer (an NN/g researcher)3 has developed matrices for these categories, which are also included in the following subsections.
Behavioral vs. Attitudinal
You can approach research from a usercentric perspective and think about the users’ actions, such as what they do in a situation. Perhaps you could create a prototype, give it to people, and watch where they click around the interface. This would be behavioral research in that you would observe behaviors as people took actions in an experience.
Alternatively, you could think about the opinions of the users, such as what they think or feel about a situation. Perhaps you use that same prototype, but instead of watching people click around the interface, you ask for their opinions of that interface. Is it intuitive? Does it solve their problems? Would it help them with their goals? This would be attitudinal research in that you would record what people say as they were asked questions about an experience.
If you map these two characteristics of research in a chart, you’d get something like FIGURE 2.2. On the top of this axis are behavioral types of research, based on what people do. On the bottom of this axis are attitudinal types of research, based on what people say.
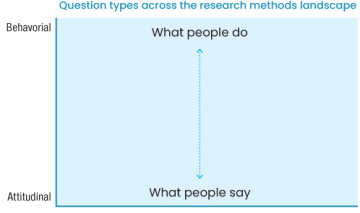
FIGURE 2.2 Christian Rohrer’s research methods landscape matrix. This portion of the matrix maps out behavioral research versus attitudinal research.
An example of behavioral research would be something like eye tracking, where a user’s eye movements are monitored as they look at an interface. This type of research has produced, for example, the F-pattern and Z-pattern4 for the web.
An example of attitudinal research would be something like a user interview, where a researcher talks with users to understand more about their goals, wants, and needs. This type of research has produced design artifacts like personas (representations of our target user), where you attain a better understanding of the people you design for.
Qualitative vs. Quantitative
You can also approach research strategy from a feedback perspective. Are you obtaining information directly, by having a conversation with users? Or are you obtaining it indirectly, by having them fill out a survey?
If you map those characteristics to a chart, you’d get something like FIGURE 2.3.
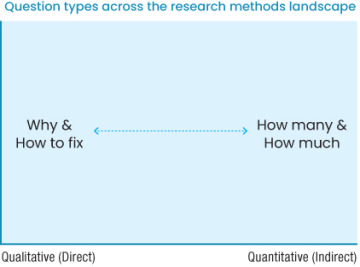
FIGURE 2.3 Christian Rohrer’s research methods landscape matrix. This portion of the matrix maps out qualitative research versus quantitative research.
On one side of the x-axis are direct research methods, which are qualitative and based on a why. On the other side of the x-axis are indirect research methods, which are quantitative and based on a quantity.
An example of qualitative research would be a focus group, where you bring in several users to discuss a problem and work with them to understand why that problem exists and how to fix it. Focus groups are less common in product design, but could still occur in the context of branding, for example.
An example of quantitative research would be an unmoderated UX study, where participants try to complete tasks in a UI without any direction or guidance. You gain quantitative data, learning how many users can complete a task or how much time it takes to complete the task without guidance.
The Research Landscape Chart
If you combine these two axes, you get the chart in FIGURE 2.4. Using this matrix, you can map out all the different types of user research to consider (FIGURE 2.5).
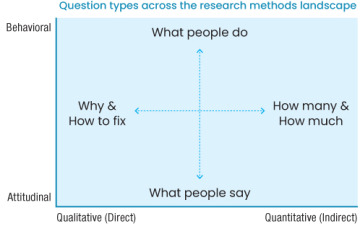
FIGURE 2.4 Christian Rohrer’s research methods landscape matrix, fully put together.
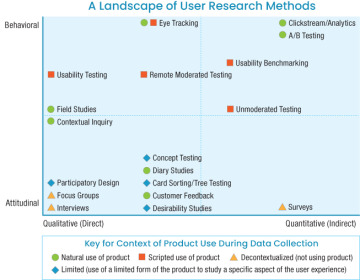
FIGURE 2.5 Christian Rohrer’s research methods landscape matrix, filled in with example types of research. An interview, for example, is a form of attitudinal, qualitative research, as you record the opinions people have and form qualitative data. A/B testing is a form of behavioral, quantitative research, as you record the actions people take in an experience and form quantitative data.
Figure 2.5 includes a comprehensive list of the different types of research available to you as a designer. Based on this matrix, you can start to think about how to conduct research.
Do you need to talk with users via an interview? If so, you need direct contact with those users and attitudinal questions to ask them. What are their goals when they come to the product? What are some of the pain points when using our product? How do they currently solve their problems? You can start to structure the research approach depending on the type of research you choose to conduct.
Conversely, you can use this matrix to think about the type of data you want to know. Are you curious about click-through rates in our product? Well, you need to know how many people can complete a task on our website, and how much time it takes for them to do so. Referencing the matrix, you see that you want quantitative, behavioral information, and from there choose a method like clickstream analysis.
Now that you have a sense of the types of research you can conduct and what categories they fall under, let’s look at the instances in which you’ll want to use these methods.
Stages of Design Research
Depending on where you are in your projects (and your research budget), you will want to conduct different types of research. You can think of research occurring in three points in time:
Before you begin to design (before the ideate step of the design thinking process)
After you have created some designs (after ideate, but before implement)
After your designs have been released (after implement)
Formative Research
The purpose of formative research is to align what you want to make with what users want to use. The goal is to build a picture of users while also understanding any solutions that currently exist to their problems. You have several methods you can use to get a better understanding of these things.
Surveys
Surveys are a great way to get a lot of information about users with a small amount of time invested. You can create a form with a few questions you want answers to and send it to a lot of participants to generate qualitative and quantitative information. Additionally, you can create screener surveys, which function as a filter for finding users you really want to talk with (FIGURE 2.6).

FIGURE 2.6 A survey question about online purchasing habits
Interviews
Once you’ve identified a few users you want to talk with, you can schedule conversations with them. User interviews (FIGURE 2.7) are excellent opportunities to directly ask questions and better understand people’s motivations. You can go into detailed conversations to understand what they need, and dive deeper into those needs by asking “why?” directly.

FIGURE 2.7 In a user interview, a researcher asks questions about a person’s opinions and experiences to gain data about their wants and needs. (Edvard Nalbantjan/Shutterstock)
Competitive Analysis
In addition to understanding your users, it’s crucial to understand the products that exist in the marketplace. Are there other businesses that have solved this problem already? What can you do to solve the problem differently? Are there common conventions in your industry that you need to be aware of as a designer, such as the way users are used to seeing content? By understanding the competition, you can get a sense of what works, what doesn’t, and how you can improve it.
You can do competitive research in many ways. You can create a comparison table (like the one in FIGURE 2.8) to identify which features are most prominent across different products, which would let you know market expectations. You can conduct usability tests of your competitors’ products to better understand the usability of those products and see what does or doesn’t work for users. You can do user-perception tests of other products to learn how people experience those products and what they think of the competition. You can do a lot related to competitive analysis. Chapter 3, “Defining the User’s Problem,” will go into more detail.
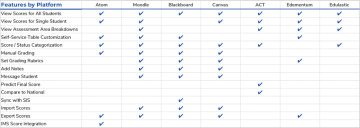
FIGURE 2.8 A table comparing the features of a new platform to those of its competitors.
Figure 2.8 is an example of some formative research I did for a project at Kaplan. I was working on a dashboard redesign for educators that informed them of their students’ progress throughout a course. The product manager for that project talked to teachers daily and asked a few of them to participate in user interviews. We spoke to those teachers to understand how they used the platform in its current form, and we learned of some places we could improve. This research was formative—it allowed us to form opinions about the problems we wanted to solve.
Additionally, we looked at competing educational platforms that had dashboards for teachers to learn about student progress. We made a comparison table (Figure 2.8) that allowed us to understand which features were more common across all our competitors. This was also formative research. Based on the table, we formed opinions on what features to focus on for the relaunch of our platform.
Once you have a good understanding of your users and competitors, you would move on in the design thinking process. You’d define the problem to solve, ideate possibilities, and eventually design solutions. When those solutions are ready to be shown to users, you’d conduct usability research.
Evaluative Research
The purpose of evaluative research (FIGURE 2.9) is to validate assumptions and make sure designs work. Can users use what you made? Does it make sense, and is it intuitive? Or does it fail? That’s OK too—you haven’t launched it yet. You need to know what works and what doesn’t so you can improve your designs and release them.

FIGURE 2.9 A usability study in which a researcher asks someone to use an experience and provide feedback about it. (Gaudilab/Shutterstock)
This works with anything you’ve made: sketches, wireframes, prototypes, live apps, or even websites. You can conduct usability research in the earlier steps of the design thinking process with, for example, competitor products to expose the usability issues in those products. Or you can conduct usability research on your existing product, to learn how you can enhance it.
You can also revisit conversations with users you spoke with during the background research. A user you interviewed at the start of your project could come back to test the designs, and you could ask them how well you succeeded.
Going back to the Kaplan example, we also performed evaluative research on our redesign of the dashboard. We conducted usability testing with the users we interviewed—the teachers who were going to use the platform—and asked them to complete a few tasks in a prototype. We observed their thoughts and feelings as we tracked task completion rates, places where the designs didn’t make sense to them, and the elements of our design that really worked well. With this evaluative research, we were able to evaluate what worked about the design and what didn’t so that we’d know what we needed to revise before we built the product.
Once your evaluative research is in a place where you feel ready to implement the designs, you can move on in the process. You would finish your designs, build them with developers, then watch as users start to adopt your product. After some product usage, you could conduct research to see how our product is doing.
Summative Research
The purpose of summative research (sometimes called ROI, or return on investment, research), is to see the product’s performance. How is what you made doing? How is it performing in terms of its design, usability, sales, revenue, conversion, or engagement?
Several methods are very informative for this type of research.
Analytics
Analytics allow you to gather a large amount of quantitative data (FIGURE 2.10) about how things are performing. For example, you could observe your SEO (search engine optimization) to understand how many people come to your website and how often. It’s behavioral rather than attitudinal, however, so you won’t necessarily understand why.

FIGURE 2.10 Analytics provide behavioral insight into how people move around a product and use it, such as what source they come from, how long they stay in the product, and what actions they take while they are in it. (a-image/Shutterstock)
A/B Testing
You could also conduct A/B testing in your product (FIGURE 2.11). What is it like to change a word or a color? To move an image from the left side of the screen to the right? This type of testing is quite granular and happens with more mature products looking to optimize their designs. Google is famous for an extreme example of this type of testing, where they tested 41 different shades of blue to determine the optimal color for incentivizing engagement.5
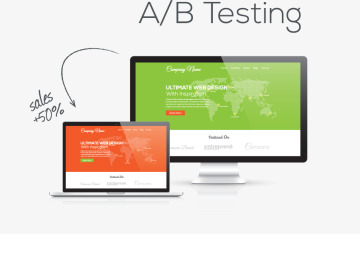
FIGURE 2.11 A/B testing allows you to test two versions of a design to understand which one performs better. Even simple changes, like changing a color, can result in improved results for the product. (mpFphotography/Shutterstock)
User Engagement Scores
A more attitudinal research method for understanding the performance of your product is to ask users how they feel after using it. One way to do so is by using CSAT, or customer satisfaction, scores (FIGURE 2.12). This method asks users to rate whether their expectations have been met after using the product. You can take those ratings and average them to determine how satisfied users are after using a product.
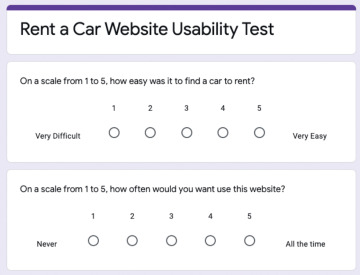
FIGURE 2.12 A survey that asks for user engagement scores.
Since this is the first stage of the design thinking process, you’ll want to conduct background research. That means you’ll need to understand who the users are, and what currently exists to help them.
For the student progress dashboard redesign project at Kaplan, we conducted summative research as well. After we launched the redesign, we spoke with teachers to hear more of their thoughts about the product. We tracked the performance of the platform, such as which features were being used more than others. We also collected user-engagement scores in a process like the survey in Figure 2.12.
Research Is an Ongoing Process
User research can happen at any stage in your product’s lifecycle. You may need to understand more about the problem you’re trying to solve—if so, conduct background research. If you’re wondering whether people can use your solution, conduct usability research. If you’re more curious about how your product is performing, conduct ROI research.
Truthfully, you should be doing all three types of research for your products. Learning more about our users and how you can help them with their goals is an ongoing process that allows you to make the best solutions you can for the people you design for.
