- Entering Weight Data
- Changing Weight Units
- Showing Weight History
- Showing Detail Views
- Wrapping Up
This chapter is from the book
This chapter is from the book
This chapter is from the book
Showing Detail Views
There is still one piece left to implement. When the user selects one of the weights, we want to display detailed information about our weight entry. Unfortunately, once you’ve listed the weight and the date, there’s really not much more you can say about a single WeightEntry, so we will fill out our detail view by comparing the selected weight entry with the minimum, maximum, and current monthly average from our WeightHistory.
We will also look at using static tables to organize and display our data. Static tables are a very convenient way to display a fixed set of information. We lose a little bit of flexibility in that we cannot change the number, order, or types of rows in our table. However, we can build our entire interface directly in the storyboard. We don’t even need to implement a data source for our table.
Designing the Static Table View
Open the storyboard and zoom in on the detail view scene. First things first, let’s turn it into a static table. Select the table view, then set its Content attribute to Static Cells. We also want to change the Style attribute to Grouped. This should give us a rounded bubble of three blank cells against a striped gray background (Figure 4.24).
)
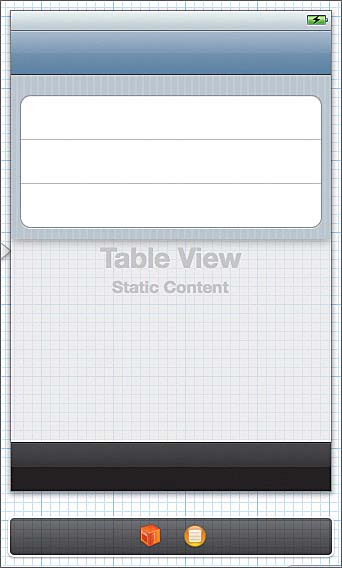
Figure 4.24 After converting to a grouped static table
Now select and delete all but one of these cells. Select the remaining cell and change its Selection attribute to None. Then, drag out a label and place it in the row. Set its font size to 16pts, center it vertically, and align it with the left margin. Change its text to Monthly Average, and right-align the text. Finally, make sure the cell’s Autosizing settings are locked to the top and the left side.
Next, drag out a text field and position it so it’s centered vertically. Stretch it so it fills the space between our label and the row’s right margin. Its Autosizing settings should be locked to the left, right, and top, with horizontal scaling enabled. Finally, deselect the text field’s Enabled attribute. This will make the text field readonly. We can use it to display text, but the users won’t be able to edit it (Figure 4.25).
)
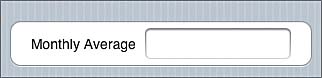
Figure 4.25 Our initial cell design
There’s a nice benefit to creating cells in our storyboard. Once we’ve designed one, we can copy it to create the others. This is a very easy way to create a number of controls, while keeping them all the same size and properly aligned.
Select the Table View section, and then change its Rows attribute to 2. We should now have two identical rows grouped together. While we’re here, change the Header attribute to Weight Entry.
Now select the table view itself. Change the Sections attribute to 2. This gives us two groups of two rows each. Notice that this copies everything, including the header. To modify the bottom section, select it and change its header to Statistics. Change its Rows attribute to 3. Now go through each row and set the label text. Starting at the top, they should be Weight, Date, Monthly Average, Loss from Max, and Gain from Min. When you’re done, the interface should match Figure 4.26.
)
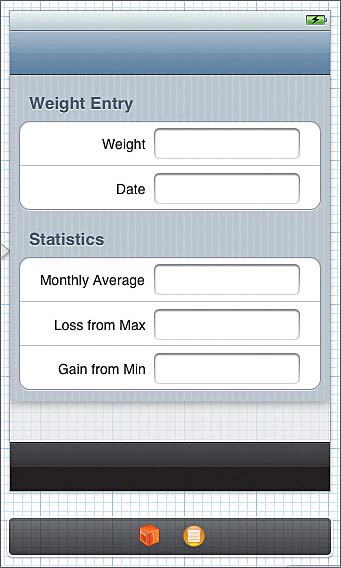
Figure 4.26 Finished detail view interface
Now let’s create outlets for all our text views. Open the Assistant editor and make sure the DetailViewController.h file is showing. Control-drag from each text field to the header file. Name the outlets weightTextField, dateTextField, averageTextField, lossTextField, and gainTextField, respectively.
Now, switch back to the Standard editor and open DetailViewController.m. First things first, we no longer need a data source. Delete the following methods: numberOfSectionsInTableView:, tableView:numberOfRowsInSection:, and tableView:cellForRowAtIndexPath:.
Finally, we need to fill in our text fields with actual data. We will do this in the viewWillAppear: method. This lets us update the displayed values each time the view appears. However, this method gets a bit long, so let’s examine it in chunks.
- (void)viewWillAppear:(BOOL)animated {
    [super viewDidAppear:animated];
    WeightUnit unit = self.weightHistory.defaultUnits;
    WeightEntry* currentEntry =
        [self.weightHistory.weights objectAtIndex:
        self.selectedIndex];
    CGFloat weight = [currentEntry weightInUnit:unit];
    // If the entry is within the same month.
    NSDate* startOfMonth;
    NSTimeInterval monthLength;
    [[NSCalendar currentCalendar] rangeOfUnit:NSMonthCalendarUnit
                                    startDate:&startOfMonth
                                     interval:&monthLength
                                      forDate:currentEntry.date];
First, we get some basic values. We grab the default unit value and the WeightEntry for the currently selected index. Then we extract the weight from our entry for the given unit.
Once we have the basic data, we want to calculate the start and length of the current month. We do that using the NSCalendar rangeOfUnit:startDate:interval:forDate: method. Notice that the startDate and interval are output-only arguments. You select a date and a calendar unit, and the method calculates the start and interval values for you.
CGFloat minWeight = CGFLOAT_MAX;
CGFloat maxWeight = CGFLOAT_MIN;
int monthlyCount = 0;
CGFloat monthlyTotal = 0.0f;
for (WeightEntry* entry in self.weightHistory.weights) {
    CGFloat sampleWeight = [entry weightInUnit:unit];
    if (sampleWeight < minWeight) minWeight = sampleWeight;
    if (sampleWeight > maxWeight) maxWeight = sampleWeight;
    // Check to see if it's in the same month.
    NSTimeInterval timeFromStartOfMonth =
        [entry.date timeIntervalSinceDate:startOfMonth];
    if (timeFromStartOfMonth > 0 &&
        timeFromStartOfMonth <= monthLength) {
        monthlyTotal += sampleWeight;
        monthlyCount++;
    }
}
CGFloat monthlyAverage = monthlyTotal / (float)monthlyCount;
Next, we iterate over the weight history, looking for the minimum and maximum weight values. We also use the timeIntervalSinceDate: method to calculate the number of seconds between our startOfMonth date and the given WeightEntry’s date. If this is a positive number (meaning the weight entry occurred after the month began) and it is less than our monthLength interval, then it falls within the month in question. We add the weight to our monthly total, and we increment our monthly count.
Once we have iterated over the entire history list, we calculate the monthly average from our total and count.
    // Now fill in our values.
    self.weightTextField.text =
        [WeightEntry stringForWeightInLbs:weight inUnit:unit];
    if (weight < monthlyAverage) {
        self.weightTextField.textColor = [UIColor colorWithRed:0.0f
                                                         green:0.5f
                                                          blue:0.0f
                                                         alpha:1.0f];
    }
    if (weight > monthlyAverage) {
        self.weightTextField.textColor = [UIColor colorWithRed:0.5f
                                                         green:0.0f
                                                          blue:0.0f
                                                         alpha:1.0f];
    }
    self.dateTextField.text =
    [NSDateFormatter
     localizedStringFromDate:currentEntry.date
     dateStyle:NSDateFormatterShortStyle
     timeStyle:NSDateFormatterShortStyle];
    self.averageTextField.text =
        [WeightEntry stringForWeightInLbs:monthlyAverage
                                   inUnit:unit];
    self.lossTextField.text =
        [WeightEntry stringForWeightInLbs:maxWeight -
            weight inUnit:unit];
    self.gainTextField.text =
        [WeightEntry stringForWeightInLbs:weight -
            minWeight inUnit:unit];
}
Here we fill in our text fields. Again, we use the stringForWeightInLbs:inUnit: class method to generate properly formatted and localized weight strings. The only catch here is the weightTextField. If the current WeightEntry’s weight is less than the monthly average, we set the text color to dark green. If it is greater than the monthly average, we set it to dark red. Here, we are using custom colors by specifying their RGBA values (Figure 4.27).
)
)
Figure 4.27 Filling in the detail view
There’s one last step. Modify shouldAutorotateToInterfaceOrientation: so that it returns YES, allowing us to rotate into any orientation.
- (BOOL)shouldAutorotateToInterfaceOrientation:

    (UIInterfaceOrientation)interfaceOrientation
{
    return YES;
}